If you will choose this field for yourself, you will definitely realize that you have to do your best to learn all the necessary things. - Integrity Spas
Digital Files Vs. Scanned Medium Format Film
We Put The Mediums To The Test
Very few people would dare
to ask this question, "Is digital better than film?" just
a few years ago when the only cameras that could produce a digital file
with qualities that approached film's capabilities cost in the
neighborhood |
|||||||||
The Test Setup |
|||||||||
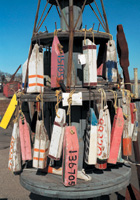
Our first shot was of a standard Kodak Gray Scale card with 20 solid-colored rectangles representing a white to black density range. The same shot included the Kodak Color Control Patch strip with rectangles of blue, cyan, green, yellow, red, magenta, white, and black. Newburyport's maritime culture provided us with intriguing photo opportunities that included colorful, weathered lobster-trap buoys and a range of gray values in aged wooden fishing gear. |
|||||||||
My film was processed by a local photofinisher whose Fuji Frontier digital lab I know to be well maintained and clean (Cameras, Inc., Arlington, Massachusetts). Conventional 11x14" C-Prints, printed directly from the negatives, were made by a commercial color lab (Advanced Photographics, Danvers, Massachusetts). With film in hand this was an ideal opportunity to test out the new Epson Perfection 4870 Pro flat-bed scanner. I could have scanned the negs on a high-end drum scanner or pre-press quality flat-bed, but in the interest of equalizing the competition I assumed the Epson to be in the same quality and price class as the Nikon D100. |
|||||||||
Comparing The Files
And Prints |
|||||||||
Examining side by side screen
displays of the three paired files, my first impression was that they
were very close in quality and accuracy; although the film showed slightly
better highlight and shadow detail. But a more objective analysis was
called for. Using Photoshop's eyedropper tools and floating color
palette I measured the density of each of the 20 gray scale patches (Figures
1, 2) and plotted them on a graph with a 0-100 percent range (Figure 3).
The plotted graph confirmed what I could see with my eye--more density
of the film image in the minimum density patches and more differentiation
between the darkest patches at the other end of the scale. |
|||||||||
Enlarged sections of each file
also give the edge to the film in apparent sharpness (Figures 9, 10). Conclusion Paul Mozell is professional photographer, writer, and consultant. See his work or contact him at: mozellstudios.com. |
- Log in or register to post comments


